Cyclic curves
This notebook is an example on how to repeat yearly curves with API help.
Supported curves (TxyLin) can be cyclical and most will repeat yearly. By defining a curve between years 1703-1704, it will be automatically repeated for each data year.
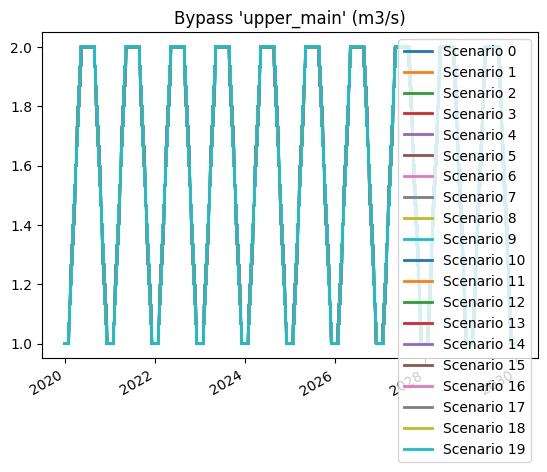
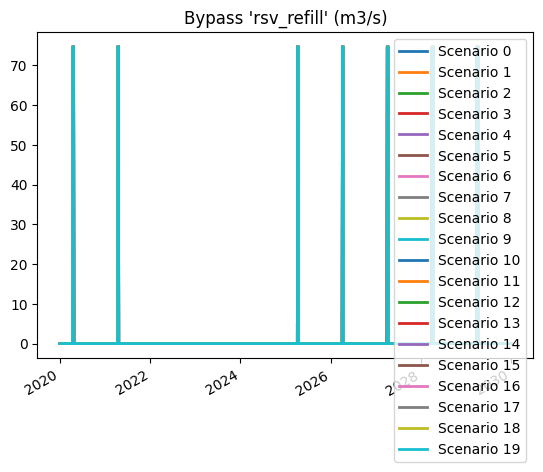
A definition of a minimum bypass curve that will repeat yearly may look like this:
"min_bypass_curve": {
    "timestamps": [
        "W05",
        "W20",
        "W35",
        "W50"
    ],
    "scenarios": [
        [
            1,
            2,
            2,
            1
        ]
    ]
}
It will repeat, and be linearized, giving this repeating pattern with a data period over 10 years.

[1]:
import os
import numpy as np
from pyltmapi import LtmSession, LtmPlot, LtmDot
import pyltm
import json

import logging
logging.basicConfig(level=logging.INFO)

from pathlib import Path

ltm_core_path =  os.environ.get("LTM_CORE_PATH", str(Path("~").expanduser().joinpath("ltm/release/bin/")))
license_file = os.environ.get("LTM_CORE_LICENSE_FILE", str(Path("~").expanduser().joinpath("ltm/ltm-license.dat")))
[2]:
from IPython.display import HTML, Image, display, display_markdown

ltmapi_version = LtmSession.version()
display(f"pyltm version {ltmapi_version}")
'pyltm version PyLTM version: 0.21.0'
[3]:
def usercallback(program_info: dict, userdata: any):
print(userdata)
print(program_info)
return True
def generate_plots(ltm):
# Water values and price series
for busbar in ltm.model.busbars():
display_markdown(f"# Busbar: {busbar}", raw=True)
# Pumped energy
if (busbar.have_water_value_results()):
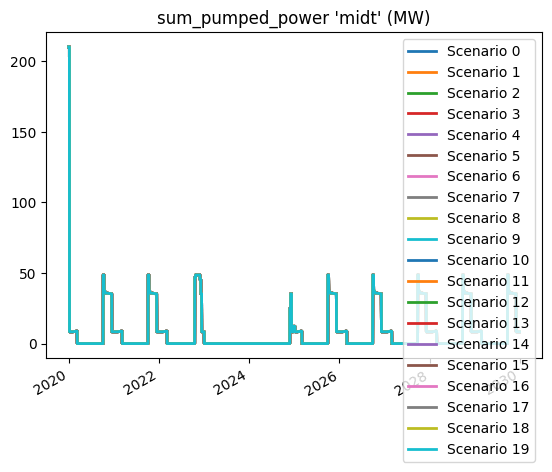
pumped_energy = busbar.sum_pumped_power()
LtmPlot.make_generic_plot(pumped_energy, f"sum_pumped_power '{busbar.name}'")
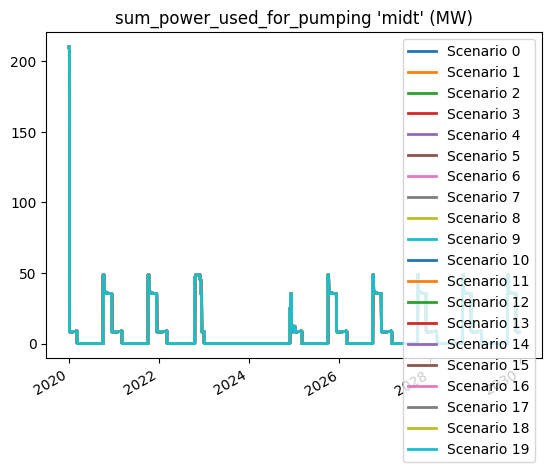
energy_pumping = busbar.sum_power_used_for_pumping()
LtmPlot.make_generic_plot(energy_pumping, f"sum_power_used_for_pumping '{busbar.name}'")
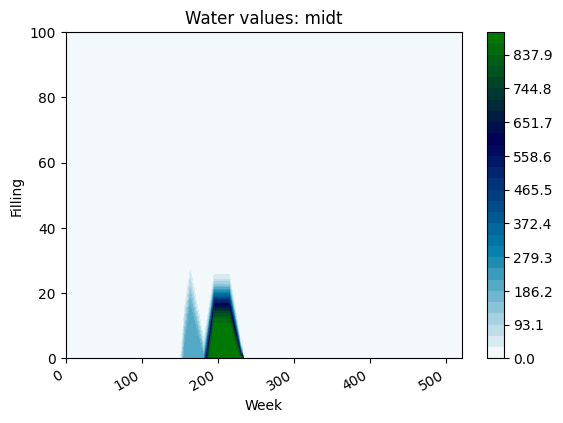
# Water values
if (busbar.have_water_value_results()):
LtmPlot.make_water_value_plot(busbar.water_value_results(), busbar.name)
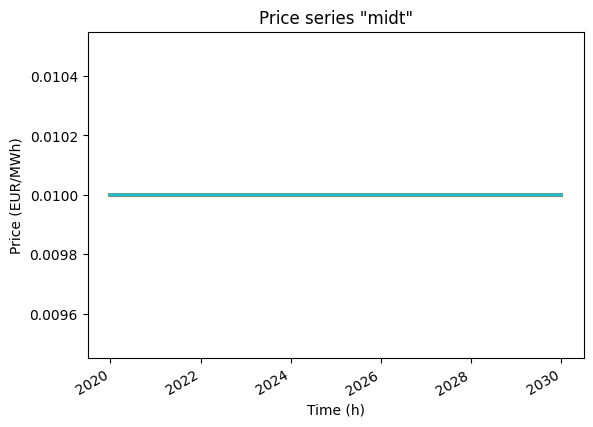
# Market results
if (busbar.have_market_results()):
LtmPlot.make_market_results_plot(busbar.market_result_price(), busbar.name)
# Detailed hydro results from
for busbar in ltm.model.busbars():
display_markdown(f"## {busbar}", raw=True)
LtmDot.display_dot_image(busbar.build_connection_tree())
# Busbar reservoirs
for rsv in busbar.reservoirs():
display("Reservoir")
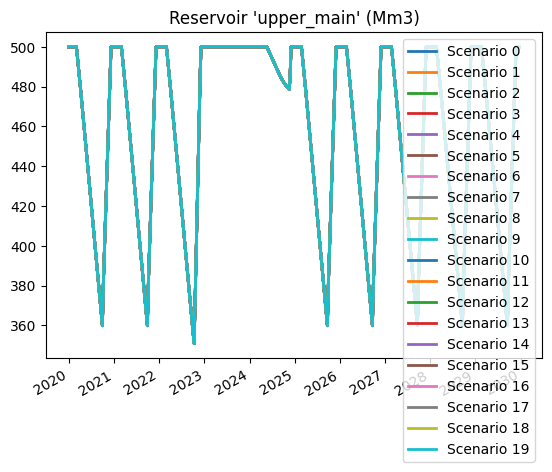
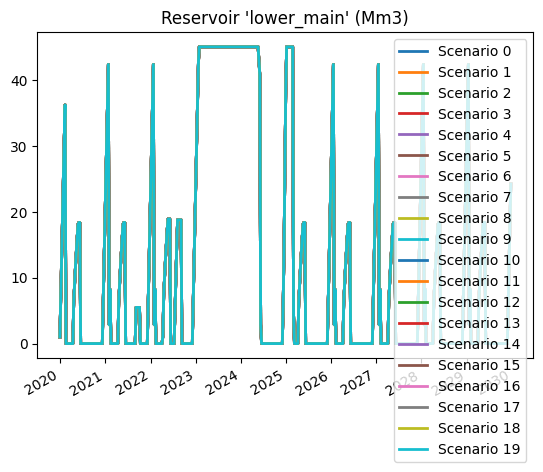
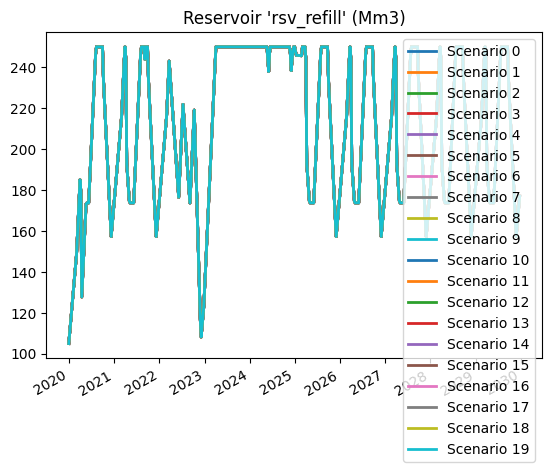
LtmPlot.make_generic_plot(rsv.reservoir(), f"Reservoir '{rsv.name}'")
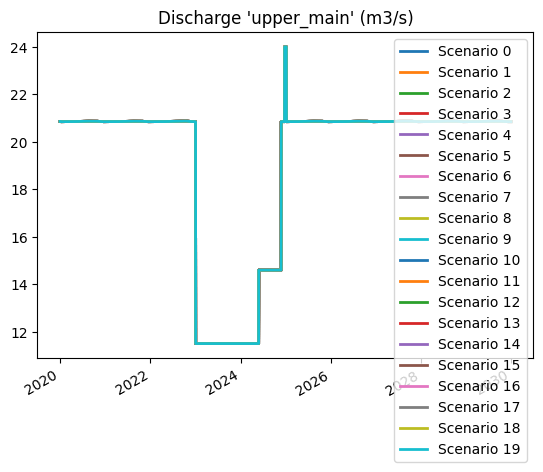
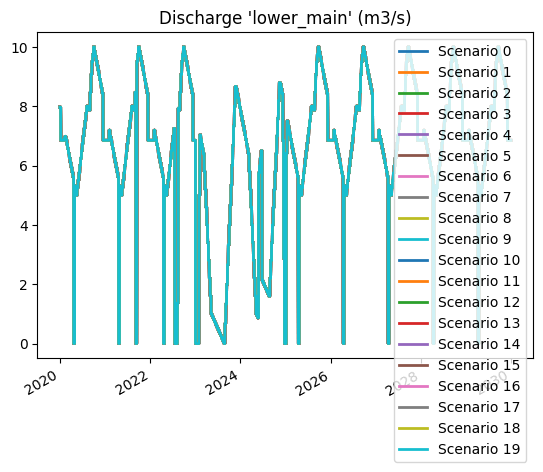
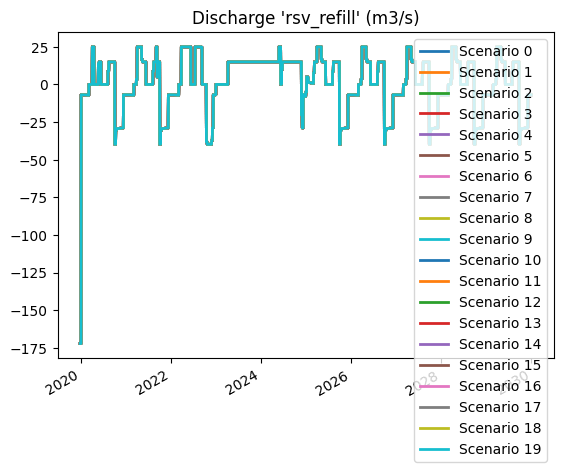
LtmPlot.make_generic_plot(rsv.discharge(), f"Discharge '{rsv.name}'")
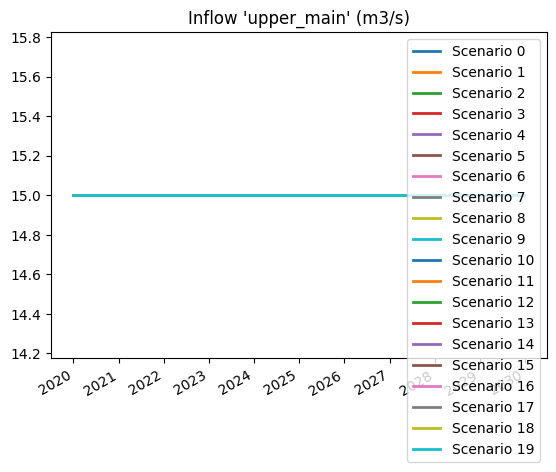
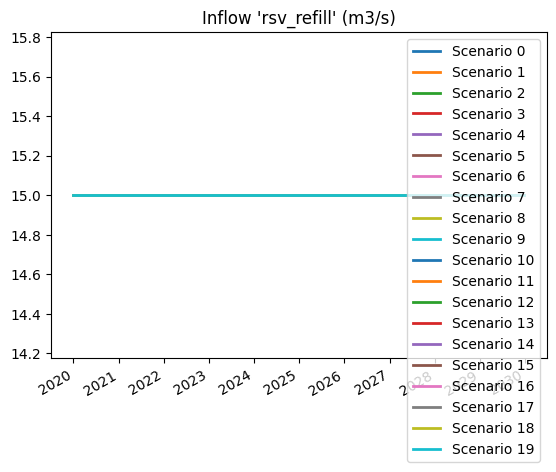
LtmPlot.make_generic_plot(rsv.inflow(), f"Inflow '{rsv.name}'")
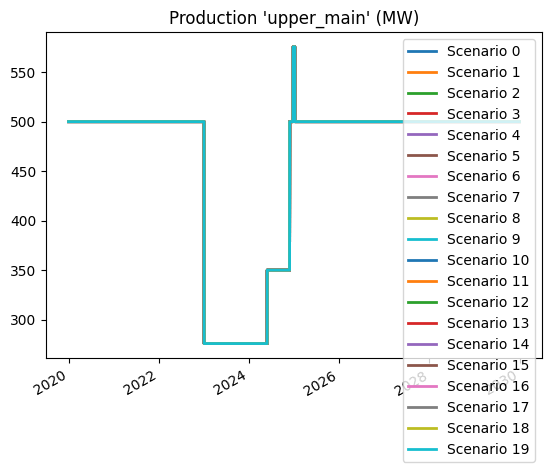
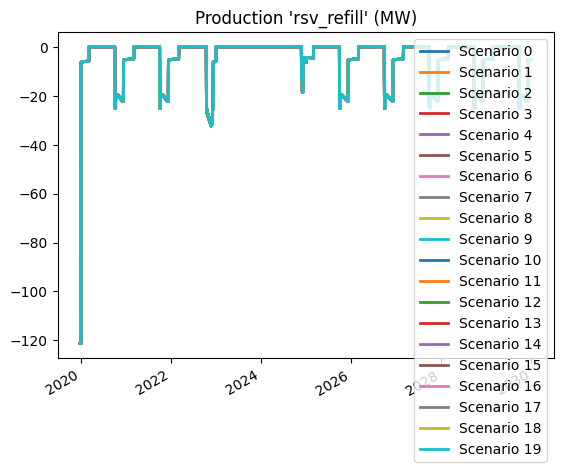
LtmPlot.make_generic_plot(rsv.production(), f"Production '{rsv.name}'")
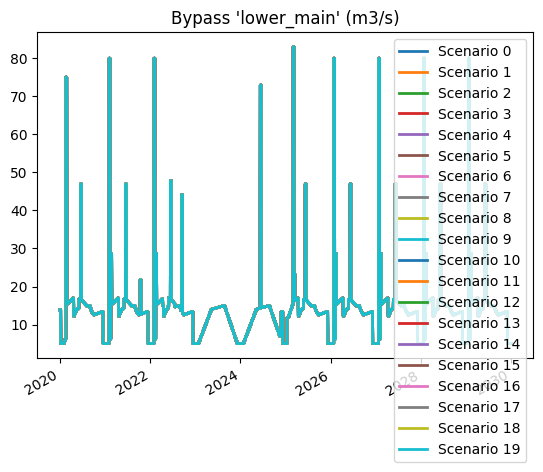
LtmPlot.make_generic_plot(rsv.bypass(), f"Bypass '{rsv.name}'")
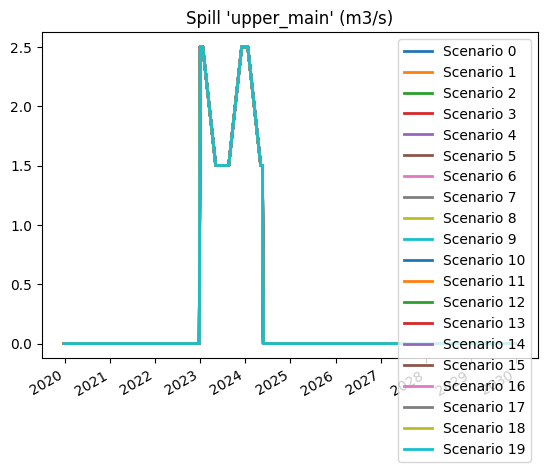
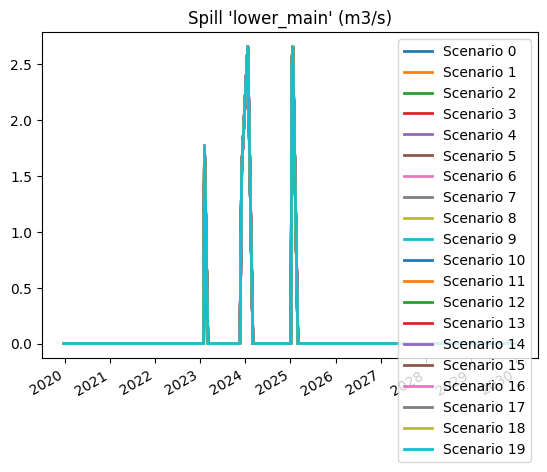
LtmPlot.make_generic_plot(rsv.spill(), f"Spill '{rsv.name}'")
[4]:
def open_and_write_model(filename: str):
    session = LtmSession("ikernel", ltm_core_path=ltm_core_path, overwrite_session=True)

    # Explicitly set license file
    session.model.global_settings.ltm_license_file_path = license_file

    session.model.global_settings.simulation_type=pyltm.SimulationType.Parallel

    with session:
        try:
            # Load model from file.
            session.load(filename=filename)
            # print(vars(session.model.global_settings))

            session.model.global_settings.model_type = pyltm.ModelType.EMPS

            # Write model to disk, and automatically generate an output directory.
            session.write_model()

            print(f"python pid: {os.getpid()}") # for debugging

            # Display model graph
            LtmDot.display_dot_image(session.build_connection_tree())
            LtmDot.display_dot_image(session.build_busbar_graph())

            # return

            # Execute/run LTM/EMPS on the model
            last_rc, results = session.execute_model()

            # If last return code is not 0, then there was an error.
            if last_rc != 0:
                err = results[0]["log_file_contents"]
                LtmDot.print(err)
            else:
                # Make plots from the results
                generate_plots(session)

        except Exception as e:
            print(e)
            raise(e)
[5]:
open_and_write_model("cyclic-curves.json")
INFO:LtmApiModel:(ikernel) Loading model from file: cyclic-curves.json
INFO:LtmApiModel:(ikernel) LtmApiModel::maybe_generate_output_dir: output_path: /builds/energy/ltm/pyltmapi/docs/ltm-api/guides/cyclic-curves/testout_cyclic_curve/2026-03-24-134239.072-EMPS-parallell
INFO:LtmApiModel:(ikernel) Using license file '/builds/energy/ltm/pyltmapi.tmp/CI_LTM_LICENSE_FILE'
INFO:LtmApiModel:(ikernel) Using license file '/builds/energy/ltm/pyltmapi.tmp/CI_LTM_LICENSE_FILE'
INFO:Validator:(ikernel) Model validation succeeded
INFO:LtmApiModel:(ikernel) Writing model to path /builds/energy/ltm/pyltmapi/docs/ltm-api/guides/cyclic-curves/testout_cyclic_curve/2026-03-24-134239.072-EMPS-parallell
INFO:Validator:(ikernel) Model validation succeeded
python pid: 1332


INFO:LtmApiModel:(ikernel) Model executed successfully
Busbar: busbar/midt
Busbar: busbar/tev
busbar/midt

'Reservoir'
'Reservoir'
'Reservoir'
busbar/tev

INFO:LtmApiModel:(ikernel) Not deleting output dir (/builds/energy/ltm/pyltmapi/docs/ltm-api/guides/cyclic-curves/testout_cyclic_curve/2026-03-24-134239.072-EMPS-parallell), as delete_output_dir: false, and has_generated_output_dir: true
INFO:LtmApiModel:(ikernel) Not deleting output dir (/builds/energy/ltm/pyltmapi/docs/ltm-api/guides/cyclic-curves/testout_cyclic_curve/2026-03-24-134239.072-EMPS-parallell), as delete_output_dir: false, and has_generated_output_dir: true