Time dependent piecewise linear constraints
Time dependent piecewise linear constraint in the LTM-core are:
min_bypass_curve
max_bypass_curve
min_discharge_curve
max_discharge_curve
min_volume_curve
max_volume_curve
in addition to the reference_curve. The linearisation is performed in the LTM-core.
In the LtmApi the TxyLin datatype is used to specify these time dependent constaints. At least two TxyLin value-pairs are required to make a linear function which represents the piecewise linear time dependent constaints. TxyLin value-pairs in the TxyLin datatype referes to points which are used for linearisation, these points must be specified correctly, thus a stricter handling of the the TxyLin datatype than the Txy datatype is necessary, see TxyLin for details.
Below are examples of how to specify a maximum volum constraint for a reservoir object with linearisation between the points.
"max_volume_curve": {
    "timestamps": [
        "2024-W17",
        "2024-W30",
        "2024-W39"
    ],
    "scenarios": [
        [
            0.0,
            70.0,
            85.0
        ]
    ]
}
The following example shows how to specify a maximum discharge constraint for a plant object. Note the break-point behavoir of the resulting curve.
"max_discharge_curve": {
    "timestamps": [
        "2024-W01",
        "2024-W17",
        "2024-W18",
        "2024-W39",
        "2024-W40",
        "2024-W52"
    ],
    "scenarios": [
        [
            15.0,
            15.0,
            10.0,
            10.0,
            15.0,
            15.0
        ]
    ]
}
These examples are shown in Fig. 1.
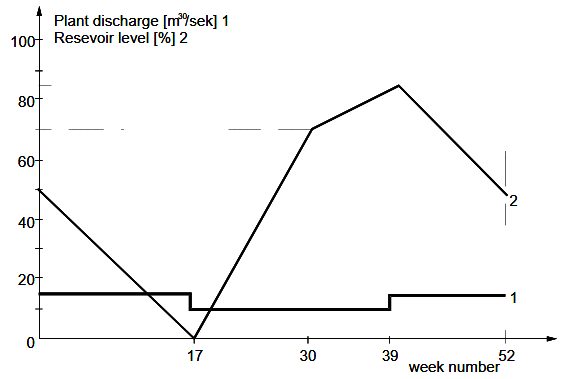
Fig. 1: Cyclic piecewise linear curve, i.e. repeated each year for the whole data period
Cyclic piecewise linear constaints
Cyclic curves are curves that will repeat for each year in the data period. Limitations are:
Only for curves of type
TxyLin.Only 1 year (52 weeks) can be repeated.
When a curve is strictly within year 1703 + 52 weeks, the API will automatically repeat it for each year in the data period.
The criteria for selecting year 1703 as the base year is:
It starts on monday 1st of January.
It is the first year after the Julian and Gregarian calendar split to feature Monday on Jan 1st.
It is far enough into the past, but not too far into the past.
Year 1900 was considered, however, we have many examples with time series starting in 1900, that should not be repeated.
Warning
Mixing timestamps for year 1703 and other years is not allowed and will result in an error message.
The easiest way to define a cyclic curve, is to use the modified ISO-week notation where the year is omitted.
"min_bypass_curve": {
    "timestamps": [
        "W05",
        "W20",
        "W35",
        "W50"
    ],
    "scenarios": [
        [
            1,
            2,
            2,
            1
        ]
    ]
}
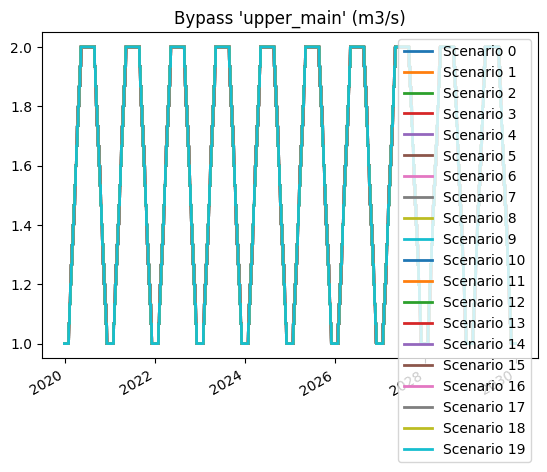
Fig. 2: Bypass curve showing minimum bypass repeated for each of the 10 years in the data period.
A complete working example can be found in this notebook:
Cyclic PQ-curves
Plants can have a yearly cycle of PQ-curves. The easiest is to use weeks W01-W52 when defining pq_curves and discharge_energy_equivalent attributes on the Plant object.
Warning
The timestamps for both pq_curves and discharge_energy_equivalent must both be within, or outside of the cyclic range. A hard error will be issued if there is a mix between cyclic and non-cyclic timestamps.
Example of a constant discharge energy equivalent with a cyclic PQ-curve.