Forecast
Forecast series is closely related to (historical) inflow series. The forecast feature
added two extra attributes on the inflow series, forecast and forecast_period.
forecast is a timeseries (Txy) with a projected inflow.
forecast_period is the range the forecast should be applied for.
It is possible to set forecast_period on both inflow series and in global settings.
Data structure
The forecast and forecast period are the two required timeseries to enable forecasts. Forecast must be set on the inflow series. Forecast period can be set on either the inflow series, or in global settings.
Inline and self contained forecast example. It will apply the forecast timeseries in the range 2023-W25 - 2023-W40.
 1"inflow_series": [
 2    {
 3        "name": "testforecast",
 4        "series": {
 5            "timestamps": [
 6                "1900-01-01T00:00:00Z"
 7            ],
 8            "scenarios": [
 9                [
10                    5.0
11                ]
12            ]
13        },
14        "forecast": {
15            "external_reference": {
16                "type": "hdf5",
17                "path": "/inflow/tannsvatn",
18                "filename": "inflow.h5"
19            }
20        },
21        "forecast_period": {
22            "timestamps": [
23                "2023-W25",
24                "2023-W45"
25            ],
26            "scenarios": [
27                [
28                    1,
29                    0
30                ]
31            ]
32        }
33    },
34]
To use the same forecast period for all forecasts, global_settings/forecast_period can be set. For inflow series without forecast_period, they will use the period defined in global_settings.
 1"global_settings": {
 2    "forecast_period": {
 3        "timestamps": [
 4            "2023-W20",
 5            "2023-W30"
 6        ],
 7        "scenarios": [
 8            [
 9                1,
10                0
11            ]
12        ]
13    }
14}
Inflow explained
This image copied from the example notebook and it has been annotated with what
the values represent and where they are from. One should expect with a constant
value of 5.0 before and after the forecast period, the value should be 5.0 and not 45.0.
EMPS will normalize the inflow series so the average value is 1.0, and then
apply a scaling ("average_regulated_inflow": 45). Both the inflow series
and forecast series will be scaled.
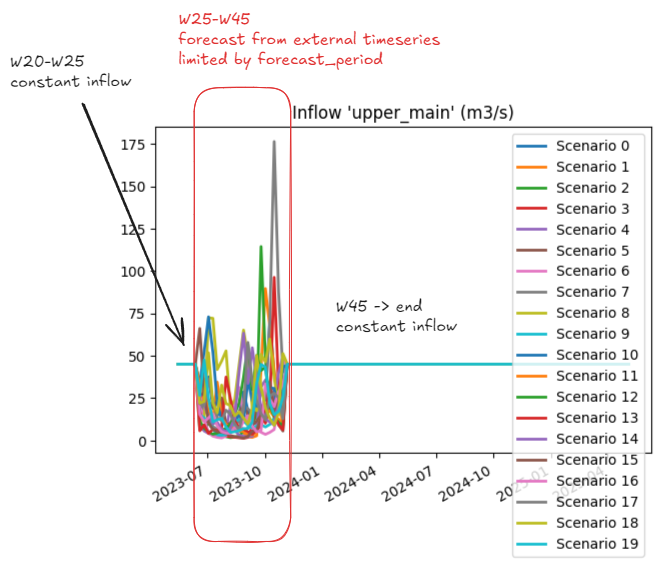
Combination of a constant inflow series with a forecast.
How the input data is transformed
ForecastData.h5 has scenario dependent data per forecast series.
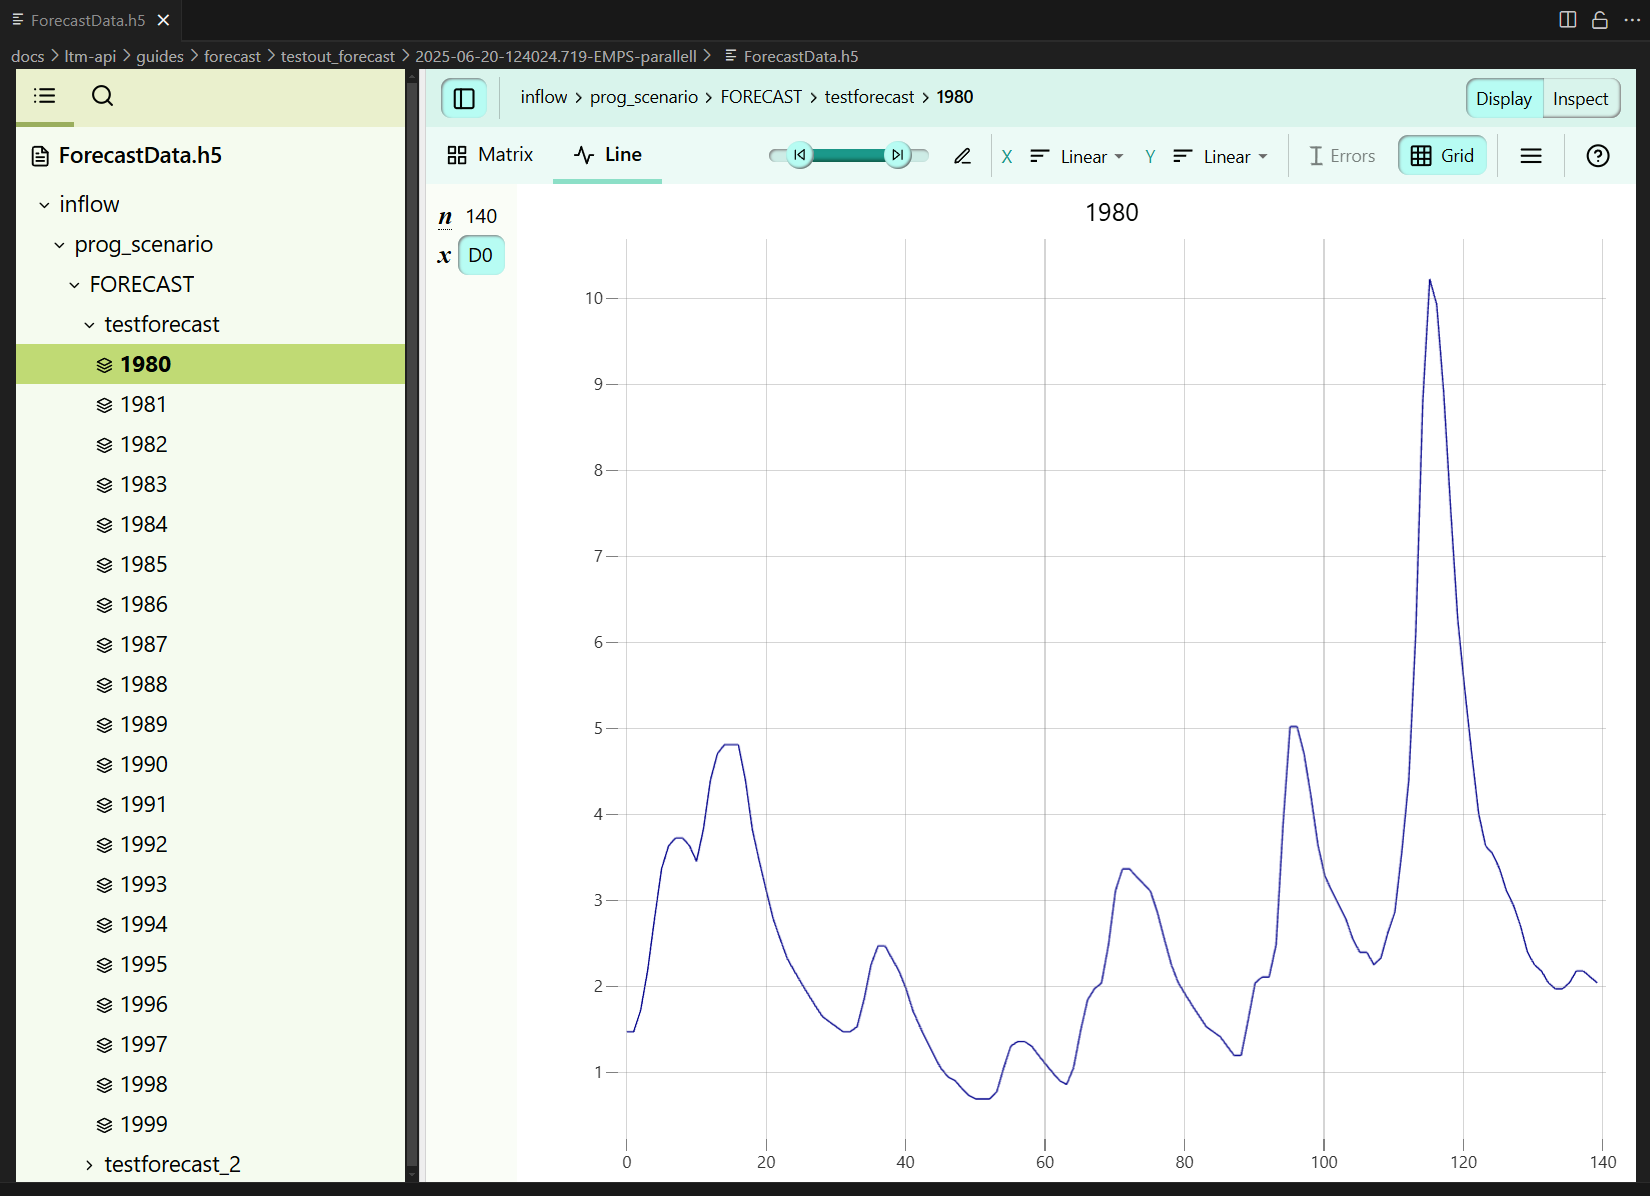
Forecast used in the example above, with 20 scenarios from 1980 to 2000.
The API can build the data required for a forecast from both a 1D and a 2D timeseries.
These plots visualizes how the forecast is combined from a 1D continuous time series into a forecast with 20 scenarios.
For this series, the forecast period is 2023-W25 to 2023-W45. When using a 1D timeseries,
the API will select data from the corresponding weeks in each historical year.
For 2D inputs there are some hard requirements.
The data must be defined for the
forecast_period.Number of dimensions must match number of historical years.
Example with 20 scenarios.