FBMC
This notebook
[1]:
import os
import numpy as np
from pyltmapi import LtmSession, LtmPlot, LtmTable

import logging
logging.basicConfig(level=logging.ERROR)

from pathlib import Path

ltm_core_path =  os.environ.get("LTM_CORE_PATH", str(Path("~").expanduser().joinpath("ltm/release/bin/")))
license_file = os.environ.get("LTM_CORE_LICENSE_FILE", str(Path("~").expanduser().joinpath("ltm/ltm-license.dat")))
[2]:
from IPython.display import HTML, display, display_markdown

ltmapi_version = LtmSession.version()
display(f"pyltm version {ltmapi_version}")
'pyltm version PyLTM version: 0.24.0.post1.dev8'
[3]:
def usercallback(program_info: dict, userdata: any):

    print(userdata)
    print(program_info)

    return True


def generate_plots(ltm):

    for dc_line in ltm.model.dclines():
        if(dc_line.have_transmission_results()):
            LtmPlot.make_generic_plot(dc_line.transmission_results(),name="Exchange " + '"'+dc_line.name+'"')

    LtmTable.make_table_cnes(ltm)
    for cne in ltm.model.cnes():
        LtmPlot.make_generic_plot(cne.get_dual_values(),name="Dual values " + '"'+cne.name+'"')
        LtmPlot.make_generic_plot(cne.get_flow_values(),name="Flow values " + '"'+cne.name+'"')


    for area in ltm.model.areas():
        print(area)

        time, area_prices = area.market_result_price()
        LtmPlot.plot_price_series(time, area_prices, area.name)

        if(area.have_aggregated_hydro_results()):
            time, aggregated_hydro_production = area.sum_hydro_production()
            LtmPlot.generic_plot(time, aggregated_hydro_production,name="Area Production " + '"'+area.name+'"')

            time, aggregated_energy = area.sum_reservoir()
            LtmPlot.generic_plot(time, aggregated_energy, name=f'Aggregated energy "{area.name}"')

        # Water values
        if (area.have_water_value_results()):
            LtmPlot.make_water_value_plot(area.water_value_results(), area.name)

        if(area.have_battery_results()):
            time, battery_production = area.sum_hydro_production()
            LtmPlot.generic_plot(time, battery_production, name=f'Battery (dis)charge "{area.name}"')

            time, battery_energy = area.sum_reservoir()
            LtmPlot.generic_plot(time, battery_energy, name="Battery stored energy "  + '"'+area.name+'"')

            time, water_values = area.water_value_results()
            water_values_np = np.array(water_values, copy=False)
            wv_for_plotting = water_values_np[:, 0, 0, :]
            max_reservoir_level = 100
            filling = np.linspace(max_reservoir_level, 0, wv_for_plotting.shape[1])
            week = np.arange(wv_for_plotting.shape[0])

            X, Y = np.meshgrid(filling, week)
            LtmPlot.plot_water_values(time, X, Y, wv_for_plotting, name=area.name)

        # extract market step results
        for market_step in ltm.model.market_steps():
            if(market_step.have_results()):
                if(area.name == market_step.area_name):
                    time, ms = market_step.results()
                    LtmPlot.generic_plot(time, ms, name="Market step"+'"'+market_step.name+'"' +' "'+area.name+'"')

        # area reservoirs
        if(area.have_detailed_hydro_results()):
            for rsv in area.reservoirs():
                display("Reservoir")
                LtmPlot.make_generic_plot(rsv.reservoir(), f"Reservoir '{rsv.name}'")
                LtmPlot.make_generic_plot(rsv.discharge(), f"Discharge '{rsv.name}'")
                LtmPlot.make_generic_plot(rsv.inflow(), f"Inflow '{rsv.name}'")
                LtmPlot.make_generic_plot(rsv.production(), f"Production '{rsv.name}'")
[4]:
from pyltmapi import LtmDot

def open_and_write_model(filename: str):
    session = LtmSession("ikernel", ltm_core_path=ltm_core_path)

    # Explicitly set license file
    session.model.global_settings.ltm_license_file_path = license_file

    with session:
        try:
            # Load model from file.
            session.load(filename=filename)

            # Write model to disk, and automatically generate an output directory.
            session.write_model()

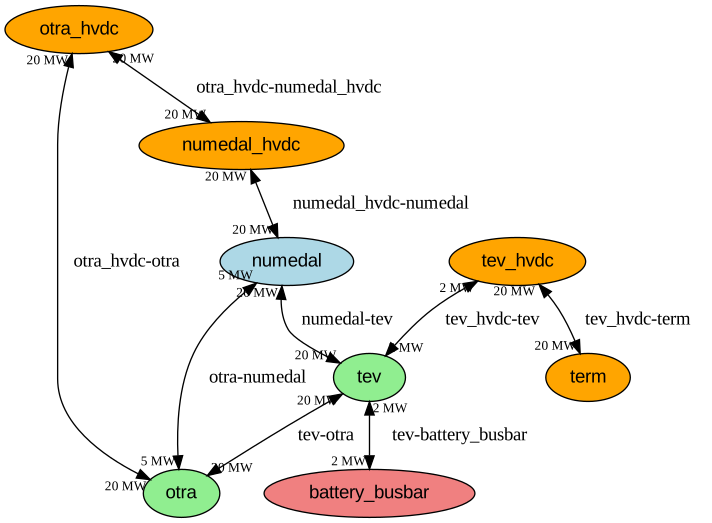
            LtmDot.display_dot_image(session.build_area_graph())


            # Execute/run LTM/EMPS on the model
            last_rc, results = session.execute_model()

            #print(f"python pid: {os.getpid()}") # for debugging

            # If last return code is not 0, then there was an error.
            if last_rc != 0:
                err = results[0]["log_file_contents"]
                display_markdown(err)
            else:
                # Make plots from the results
                generate_plots(session)

        except Exception as e:
            print(e)
            raise(e)
[5]:
open_and_write_model("fbmc_with_cnes.json") # json-file model containts cnes
# open_and_write_model("fbmc_cnes_from_jao.json") # cnes are read from separate file
ERROR:LtmApiModel:(ikernel) Found a stopword in log file contents for program 'emps'. Found: 'feil'. Input file: , log file: ./emps_sim.out